Buy Bajaj Finance Ltd For Target Rs. 1,060 By JM Financial Services Ltd
AR Analysis: Expanding horizon; changing mix
We highlight key takeaways from BAF’s FY25 Annual Report. In unsecured loans, BAF gained market share of ~420/120bps YoY in consumer durable/personal loans, aided by strong growth in EMI cards post lifting of the RBI embargo and rising share of salaried/cross-sell PLs. In salaried PL, income criteria was relaxed (INR 0.3mn in FY25 vs. ~INR 0.5mn/0.6mn in FY24/22), which broadens the customer base but raises asset quality risks. Diversification into multiple segments remain a key strength, with non-BAF auto, SME and its sub-segments like industrial equipment, CV, tractors and new car financing delivering strong traction, underscoring BAF’s pivot towards secured lending. Core fee income growth moderated in FY25 due to lower growth in distribution/foreclosure charges, and RBI disallowing prepayment penalties in a few categories from Jan’26 should put further pressure on core fee income growth in FY26. FY25 saw stress in the unsecured book intensifying, with slippages/write-offs at a 3-year high, driving a rise in Stage 2/3 assets and higher provisioning in unsecured loans. Tech spends has moderated (8% YoY in FY25 vs. 46% CAGR over FY21- 24) but earlier heavy spends done on the tech side is leading to improvement in operating leverage. We expect pressure on yields due to movement in secured segments to be offset by decline in cost of funds. Further, pressure on fee income should be largely offset by operating leverage. Credit cost in FY26/27 should moderate from FY25 levels but still remain higher than long-term trends. We expect ~23%/27% AUM/EPS CAGR during FY25-27E and maintain our BUY rating with a revised TP of INR 1,060 driven by rollover, valuing BAF at 4.4x/22x Sep’27 BVPS/EPS
Unsecured loans: Sharp market share gains in PL/CD; criteria of availing salaried personal loans coming down and more focus on higher ticket size/longer tenure loans:
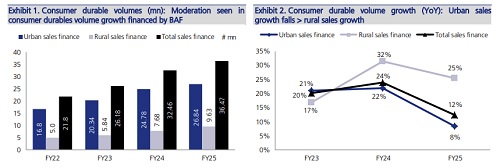
In consumer durables, despite AUM YoY growth moderating to 25% YoY in FY25 vs. 32% in FY24, BAF gained a massive ~420bps of market share on YoY basis. This might be driven by ~44% YoY growth in O/s EMI Cards in FY25 after a decline of 2% YoY in FY24 due to RBI lifting embargo on sanction/disbursal of loans under ‘eCOM’/’Insta EMI Card’ in May’24. (Exhibit 1-5) In Personal loans (ex-Gold loans), YoY AUM growth bounced back to 30% YoY in FY25 vs. 23% in FY24 leading to ~120bps YoY market share gains. We also note share of salaried personal loans (SPL) and personal loans cross-sell (PLCS) going up in the personal loans mix. However, annual gross earnings needed to avail SPL has come down to INR 0.3mn in FY25 vs. ~INR 0.5mn/0.6mn in FY24/22. This reduction in income criteria gives the company a larger customer base to cater to, though asset quality trends in the lower income salaried segment needs to be watched out for. (Exhibit 6-9) BAF also highlighted its intention of expanding term loan portfolio from 5% to 20%, with more focus on longer tenures and larger ticket sizes in this segment.
Auto/SME lending: Focus on non-Bajaj auto portfolio; multiple segments to play with:
In auto loans, BAF financed only ~18%/22% of Bajaj Auto’s 2W/3W domestic sales in FY25 vs. ~41%/49% in FY24. However, BAF financed ~0.45mn non-Bajaj Auto 2W vehicles, up ~87% YoY. (Exhibit 10-11)
In SME lending (including car financing), strong growth of 37% YoY in FY25 was supported by both its existing sub-segments and newer segments (industrial equipment financing, tractor financing, new car financing, etc.). In FY25, BAF launched industrial equipment financing (up 72% YoY), CV financing (AUM: INR 9.42bn in FY25), affordable housing and vehicle leasing reflecting BAF’s broader push into secured lending. Launched in FY24, new car financing also gained pace with AUM becoming >3x to INR 52.8bn as of FY25 (~1.3% of consol AUM). Tractor financing portfolio (launched in FY24) also stood at INR 7.1bn as of FY25 (~0.2% of consol AUM).
Unsecured SME loans for businesses and unsecured/secured loans for professionals both combined stood at INR 483.6bn, growing at 27% YoY in FY25. This needs close monitoring as far as asset quality trends are concerned. (Exhibit 12-14)
Fee income: Core fee income comes under pressure as distribution/foreclosure charges comes under pressure:
BAF’s other income grew 28% YoY in FY25 (vs. ~14% in FY24), but the underlying trend was weak as core fee income grew only ~13% YoY, while the non-recurring other income grew by ~88% YoY in FY25.
A key drag was moderation in growth of foreclosure charges (~16% YoY in FY25 vs. ~40%-60% YoY growth seen during FY22-24), which are likely to slow further with RBI disallowing prepayment penalties on LAP/MSME loans from Jan’26. (Exhibit 24-27)
Distribution income also remained muted (1% YoY in FY25) possibly due to BAF stopping incremental sourcing of co-branded credit cards of RBL/DBS bank in 3QFY25. Distribution/foreclosure charges both combined constitutes ~47% of total core fee income and growth in these segments is expected to remain under pressure.
Rising stress in unsecured loans; higher slippages/write-offs weigh in: In FY25, BAF reported its highest slippages and write-offs in the past 3 years - up 75%/69% YoY.
This led to a ~10bps YoY rise in both stage 2 and stage 3 assets, with the increase more pronounced in unsecured loans. (Exhibit 15-19)
Further, BAF strengthened its ECL models during FY25, driving higher ECL/EAD ratio, primarily on unsecured portfolio. (Exhibit 20-23)
Deposit granularity weakens:
On the liability side, deposit growth slowed to 19% YoY in FY25 (vs. 35% in FY24), while the share of granular public deposits declined to 59% in FY25 (from 73% in FY21). (Exhibit 28-31)
We note that ~41% of deposits are maturing within a year, offering potential funding cost relief in a declining rate cycle.
Technology & AI:
Scaling efficiency through digital capabilities: Tech spends growth moderated to 8% YoY (vs. 46% CAGR over FY21–24). However, huge investments made in earlier years in tech/analytics have led to improvement in cost ratios in the last few years (cost to income ratio of ~33% in FY25 vs. 35% in FY23).
Key digital initiatives included approvals of two blockchain use cases for Insurance/banking, AI-powered document automation, and AI-led content creation. With 75+ AI deployments planned for FY26, BAF aims to achieve 1.15x–2x productivity gains across frontline teams. (Exhibit 32-33)
Valuation and view: We expect pressure on yields due to movement in secured segments to be offset by decline in cost of funds. Further, pressure on fee income should be largely offset by operating leverage. Credit cost in FY26/27 should moderate from FY25 levels but still remain higher than long-term trends. We expect ~23%/27% AUM/EPS CAGR during FY25-27E and maintain our BUY rating with revised TP of INR 1,060 driven by rollover, valuing BAF at 4.4x/22x Sep’27 BVPS/EPS
Please refer disclaimer at https://www.jmfl.com/disclaimer
SEBI Registration Number is INM000010361

















.jpg)

