MOST Quantitative Outlook Monthly 04th Sept 2025 by Motilal Oswal Wealth Management

Bank Nifty
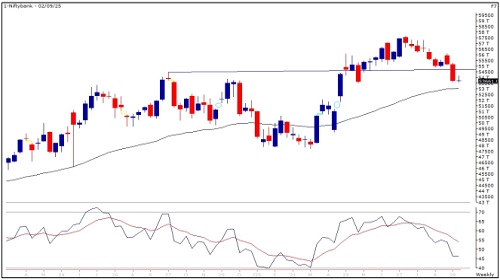
Bank Nifty clearly underperformed the broader market as intense selling pressure was seen throughout August. Every bounce attempt by the bulls was sold into, as the index struggled to sustain above 56000 marks and witnessed profit booking of more than 2200 points. Once it breached the key support of 55555, the pace of selling intensified, dragging the index sharply lower towards 53600 zones. On the monthly scale, Bank Nifty has formed a lower top pattern, indicating that the dominance of sellers may continue going forward. Price action suggests that a sustained hold below 54000 zones could open further downside towards 53000 and then 52500 zones, while on the upside, resistances are placed at 55000 and then 56000 zones.
Nifty Consumer Durables Index
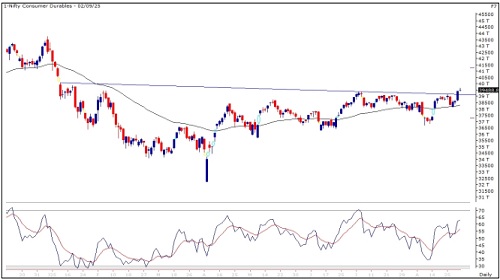
Nifty Consumer Durables Index has broken out of a consolidation zone and is respecting its 50 DEMA with slight dips being bought into. The MACD indicator is rising which confirms the bullish momentum. Thus, looking at overall chart setup we are expecting the sector to head towards 41500 and 42200 zones while on the downside support is seen at 38250 and 37500 levels.
Relative Rotation Graphs(RRG):
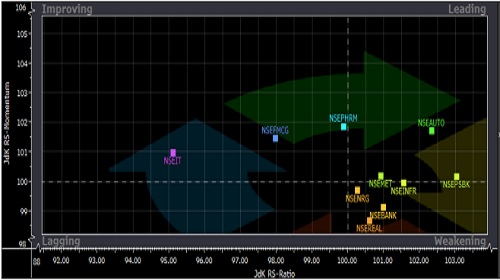
Relative rotation graphs chart shows the relative strength and momentum for group of Stocks/Indices. It allows us to compare a security against the benchmark to see if it is outperforming or underperforming the benchmark. It is derived on relative strength in which value of a sector is divided by the value of index mainly a benchmark which allows us to compare the performance of the sector. Relative Strength Ratio is normalized to oscillate around 100 (plotted on X axis) i.e Jdk RS- Ratio along with this it provides the speed and direction of the Relative strength ratio (plotted on Y axis) i.e Jdk RS- momentum. The scatter plot is divided into four quadrants i.e Leading, Weakening quadrant, Lagging and Improving quadrant.
The analysis of sectorial RRG shows that Nifty Auto and Metal are in the leading quadrant which indicates strength going ahead. Nifty Bank, Infra, Energy and Realty are in weakening quadrant which suggests momentum is likely to decline. Nifty IT, FMCG and Pharma are under improving quadrant which suggests strength is still low but momentum will start improving.
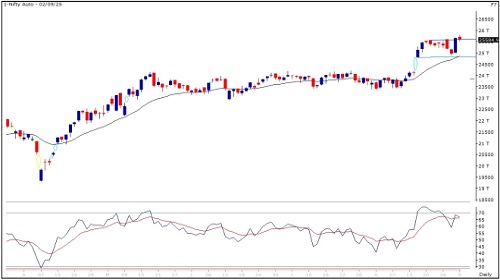
Nifty Auto Index
Nifty Auto Index has formed a bullish “Pole & Flag” pattern on the daily chart suggesting a continuation of the uptrend. It is respecting its 20 WEMA support zones with slight dips being bought into. The ADX line is rising which suggests the uptrend has strength. Thus, looking at overall chart setup we are expecting the sector to head towards 26800 and 27400 zones while on the downside support is at 24800 and 24300 levels.
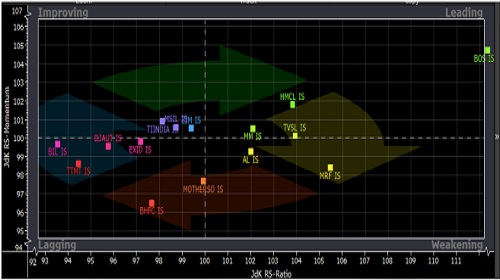
RRG For Nifty Auto
The analysis of RRG for Auto Index shows that M&M, Hero Motoco, TVS Motors and Bosch are in the leading quadrant which indicates strength going ahead. MRF and Ashokley are under weakening quadrant which suggests momentum is likely to decline. Samvardhana Motherson, Bharat Forge, Balkrishna, Bajaj-Auto, Exide and Tata motors are inside the lagging quadrant which shows strength and momentum both are missing. Maruti, Eicher, and Tube Investment are under improving quadrant which suggests strength is still low but momentum will start improving.
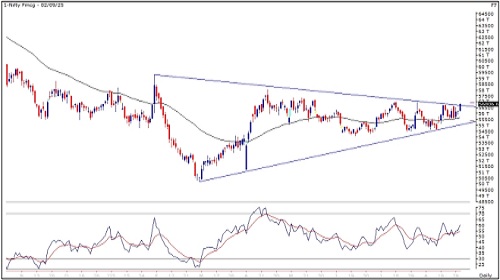
Nifty FMCG Index
Nifty FMCG Index has consolidated in a range in the last seven months and has formed a ‘Symmetrical Triangle’ pattern. The index is on the verge of breakout from this consolidation which could lead to a directional up move in the short term. It has given a “Golden Crossover” on the daily chart suggesting an uptrend. The RSI momentum indicator is rising to support the positive momentum. Thus, looking at overall chart setup we are expecting the sector to head towards 59600 and 60750 zones while on the downside support is at 55000 and 54000 levels.
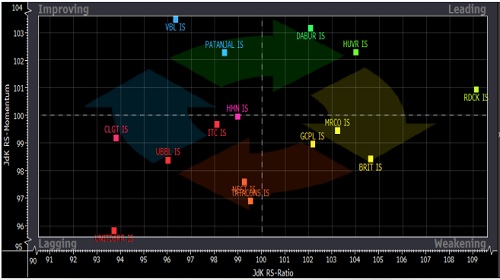
RRG For Nifty FMCG The analysis of RRG for FMCG
Index shows that Dabur, Hindustan Unilever, and Radico Khaitan, are in the leading quadrant which indicates strength going ahead. Marico, Britannia, and Godrej consumer are under weakening quadrant which suggests momentum is likely to decline. ITC, United spirits, UBL, Nestle, Tata Consumer and Colpal are inside the lagging quadrant which shows strength and momentum both are missing. Patanjali, and VBL are under improving quadrant which suggests strength is still low but momentum will start improving.
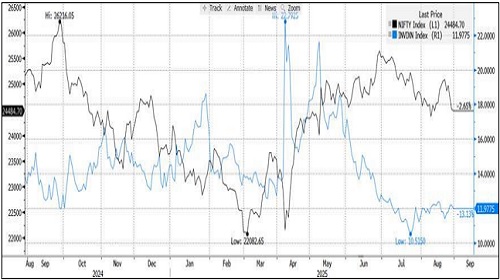
India VIX
India VIX increased by 5.17% from 11.54 to 12.17 levels in the August series. Volatility was muted and oscillated within a smaller band in the entire series.
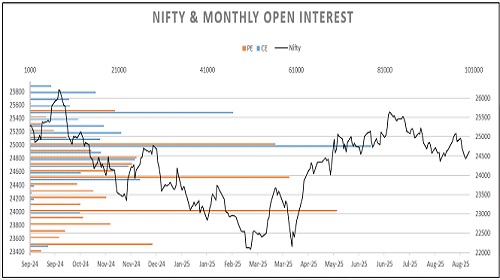
Nifty OI V/S Price
Rollover of Nifty stood at 83.6%, which is higher from its previous month and quarterly average. August series witnessed an increase in open interest by 2.8% with a decline in price by 1.1% on an expiry-to-expiry basis which indicates some short built up in the index. Rollover in Bank Nifty stood at 80.9%, which is in line with its quarterly average of 78.2%. Short built up was seen as open interest increased by 49.1% and price was down by 3.8% on an expiry-to-expiry basis. Nifty begins the September series with open interest of 16.91 mn shares as compared to 16.45 mn shares at the start of the August series. Open interest activity in Nifty has increased with declining price suggesting short positions have built as profit booking was seen.
Nifty index started the August series with profit booking and weakness in the initial days but bounced back strongly from 24350 zones. Nifty recovered by 800 points from 24350 to 25150 zones in the second part of the series but again witnessed selling pressure at higher levels and closed the series at 24500 zones. Technically, Nifty formed a bearish candle with long higher shadow on monthly chart indicating weakness and sustained selling pressure at higher levels. Put Call Ratio based on Open Interest of Nifty started the series near 0.75 and oscillated in between 0.66 to 1.28 levels to finally end the series at 0.71. On option front, Maximum Call OI is at 25000 then 26000 strike while Maximum Put OI is at 24000 then 24500 strike. Call writing is seen at 24700 then 25500 strike while Put writing is seen at 24500 then 24000 strike. Option data suggests a broader trading range in between 23800 to 25500 zones while an immediate range between 24000 to 25000 levels.
For More Research Reports : Click Here
For More Motilal Oswal Securities Ltd Disclaimer
http://www.motilaloswal.com/MOSLdisclaimer/disclaimer.html
SEBI Registration number is INH000000412


More News
MOSt Market Roundup : Nifty future closed positive with gains of 0.52% at 25079 levels by Mo...