Buy Niva Bupa Ltd for the Target Rs.101 by Motilal Oswal Financial Services Ltd

Elevated claims ratio hits profitability
* Niva Bupa posted a 20% YoY growth in NEP to INR12.2b (in line) in 1QFY26.
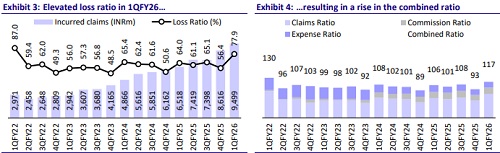
* The loss ratio at 77.9% (our est. of 72.3%) increased 1,390bp YoY due to: 1) the impact of 1/n, 2) higher reserving led by suspension of auto adjudication of claims, and 3) the 50:50 URR accounting impact of large group business written in 4QFY25. This was offset by a 330bp improvement in expense ratio, leading to a combined ratio of 117% (vs. est. of 115.4%), up 1,090bp YoY.
* The loss for 1QFY26 was INR914m vs. the loss of INR188m in 1QFY25 (vs our estimated loss of INR525m).
* The improvement in expense ratio was driven by tighter control on discretionary spending and operational leverage. The company remains confident about achieving the EoM regulatory threshold within FY26, while the claims ratio is expected to recover in subsequent quarters with the adjudication system back on track.
* Our IFRS estimates broadly remain unchanged, and we value the stock at 40x FY27E IFRS PAT to arrive at a fair value of INR101. Reiterate BUY.
Operational leverage leads to a strong improvement in expense ratio
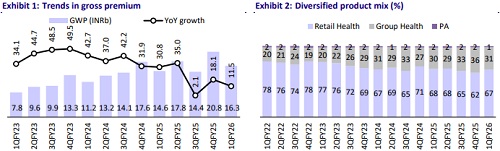
* GWP grew 11% YoY to INR16.3b, driven by 10%/16% YoY growth in retail health/ group health, while the PA business declined 15% YoY. On a pre1/n basis, GWP grew 28% YoY with retail health growing 32% YoY.
* The underwriting loss for 1QFY26 came in at INR2,336m vs. the underwriting loss of INR1,180m in 1QFY25 (est. loss of INR2,147m). This was driven by 46% YoY growth in incurred claims on the back of higher reserving, while operational expenses declined 18% YoY.
* The commission ratio at 20.2% (est. 19.9%) grew 40bp YoY largely due to 1/n impact, while net commission grew 14% YoY to INR2.6b (in-line).
* The expense ratio at 18.9% (est. 23.2%) declined by 330bp YoY on account of lower discretionary spends as well as operational leverage.
* Without considering the impact of 1/n, the claims ratio increased to 72.3%, while the expense ratio (including commission) improved to 36.7% leading to a combined ratio of 109% (106.1% in 1QFY25).
* Investment assets stood at INR81.1b at the end of 1QFY26, with investment yield at 7.3%. The solvency ratio was 2.86x in 1QFY26.
* The IFRS claims ratio for 1QFY26 increased to 66.8% (63.9% in 1QFY25) owing to 1) higher reserving due to suspension of adjudication and 2) product mix shifting towards corporate business where loss ratios are higher. The combined ratio was at 103.2% (103.9% in 1QFY25).
* The company’s hospital network increased slightly to 10,488 (10,421 at the end of FY25), while the preferred partner network increased to 681 (589 at the end of FY25).
* About 29.7%/19.4%/28.8% of the business was contributed by agents/ banks/brokers. Average ticket size per policy, excluding the 1/n impact, was INR30,711 (INR30,419 in 1QFY25), while GWP per policy sold by agents was stable at INR24,889 (INR25,058 in 1QFY25).
Key takeaways from the management commentary
* A chronic condition management program was launched in 1QFY26 through the app, aimed at bending the cost curve on claims arising from chronic conditions by promoting better lifestyle and medication adherence to avoid hospitalization.
* Claims auto-adjudication was temporarily suspended, which impacted claims processing. The share of cashless claims settled within 30 minutes dropped to 76% (from 90%), resulting in a buildup of outstanding claims.
* High single-digit price hikes are expected, with a 7% increase already taken in one of the flagship products during 1QFY26.
Valuation and view
* Niva witnessed an elevated claims ratio in 1QFY26, which can hurt its short-term profitability. However, a significant improvement was seen in the expense ratio with operational efficiency kicking in. We believe Niva has a strong position to harness the growth opportunity, with a strategic global partner, a growing customer base, a diversified channel mix, and innovative product offerings. Measures taken to mitigate claim inflation will continue to aid loss ratios, while operational efficiency will lead to expense ratio improvement going forward.
* Our IFRS estimates have broadly remained unchanged, and we value the stock at 40x FY27E IFRS PAT to arrive at a fair value of INR101. Reiterate BUY.
For More Research Reports : Click Here
For More Motilal Oswal Securities Ltd Disclaimer
http://www.motilaloswal.com/MOSLdisclaimer/disclaimer.html
SEBI Registration number is INH000000412